🚨 Coastal waters from Cape Blanco OR to Pt. St. George CA out 10 nm; Waters from Cape Blanco OR to Pt. St. George CA from 10 to 60 nm: Small Craft Advisory issued September 15 at 10:31PM PDT until September 17 at 5:00AM PDT by NWS Medford OR 🚨 Coastal waters from Cape Blanco OR to Pt. St. George CA out 10 nm; Waters from Cape Blanco OR to Pt. St. George CA from 10 to 60 nm: Hazardous Seas Warning issued September 15 at 10:31PM PDT until September 15 at 11:00PM PDT by NWS Medford OR 🚨 Coastal waters from Florence to Cape Blanco OR out 10 nm; Waters from Florence to Cape Blanco OR from 10 to 60 nm: Small Craft Advisory issued September 15 at 10:31PM PDT until September 17 at 5:00AM PDT by NWS Medford OR 🚨 Rock Springs and Green River; Flaming Gorge: Special Weather Statement issued September 15 at 11:29PM MDT by NWS Riverton WY 🚨 Upper Gila River Valley; Southern Gila Foothills/Mimbres Valley; Central Grant County/Silver City Area; Southern Gila Region Highlands/Black Range: Flood Watch issued September 15 at 11:29PM MDT until September 17 at 6:00AM MDT by NWS El Paso Tx/Santa Teresa NM 🚨 Southwest Desert/Lower Gila River Valley; Lowlands of the Bootheel; Uplands of the Bootheel; Southwest Desert/Mimbres Basin; Eastern Black Range Foothills; Sierra County Lakes; Northern Dona Ana County; Southern Dona Ana County/Mesilla Valley; West Slopes Sacramento Mountains Below 7500 Feet; Sacramento Mountains Above 7500 Feet; East Slopes Sacramento Mountains Below 7500 Feet: Flood Watch issued September 15 at 11:29PM MDT until September 17 at 6:00AM MDT by NWS El Paso Tx/Santa Teresa NM 🚨 Lea, NM; Andrews, TX; Winkler, TX: Flash Flood Warning issued September 15 at 11:28PM MDT until September 16 at 12:30AM MDT by NWS Midland/Odessa TX 🚨 Montgomery: None 🚨 Pottawattamie; Mills; Montgomery; Fremont; Page; Douglas; Sarpy; Lancaster; Cass; Otoe; Gage; Johnson; Nemaha; Pawnee; Richardson: Flood Watch issued September 15 at 11:53PM CDT until September 16 at 1:00PM CDT by NWS Omaha/Valley NE 🚨 Jefferson; Wayne; Edwards; Wabash; Perry; Franklin; Hamilton; White; Jackson; Williamson; Saline; Gallatin; Union; Johnson; Pope; Hardin; Alexander; Pulaski; Massac; Gibson; Pike; Posey; Vanderburgh; Warrick; Spencer; Fulton; Hickman; Carlisle; Ballard; McCracken; Graves; Livingston; Marshall; Calloway; Crittenden; Lyon; Trigg; Caldwell; Union; Webster; Hopkins; Christian; Henderson; Daviess; McLean; Muhlenberg; Todd; Perry; Bollinger; Cape Girardeau; Wayne; Carter; Ripley; Butler; Stoddard; Scott; Mississippi; New Madrid: Heat Advisory issued September 15 at 11:46PM CDT until September 19 at 7:00PM CDT by NWS Paducah KY
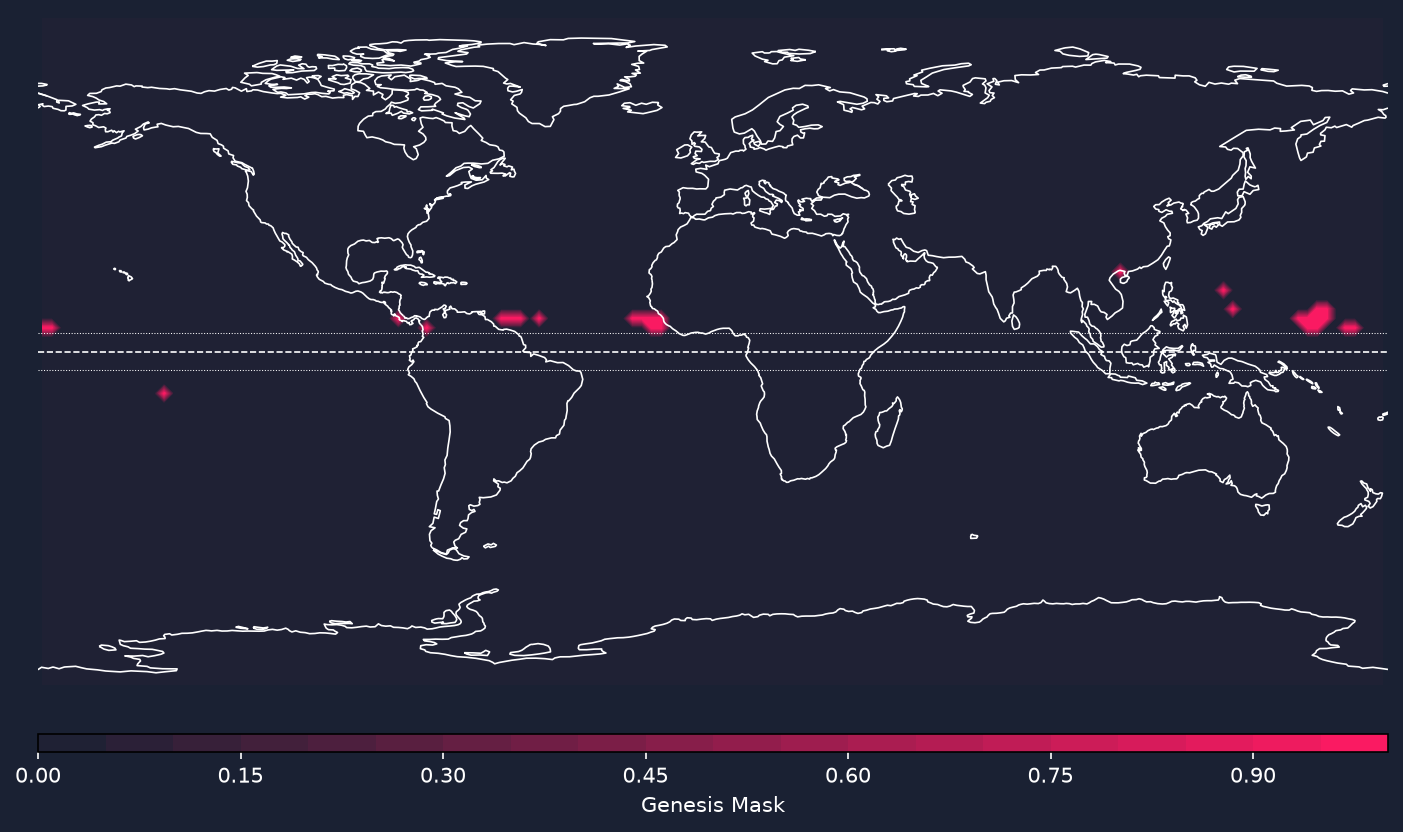
Active Tropical Systems & Formation Outlook
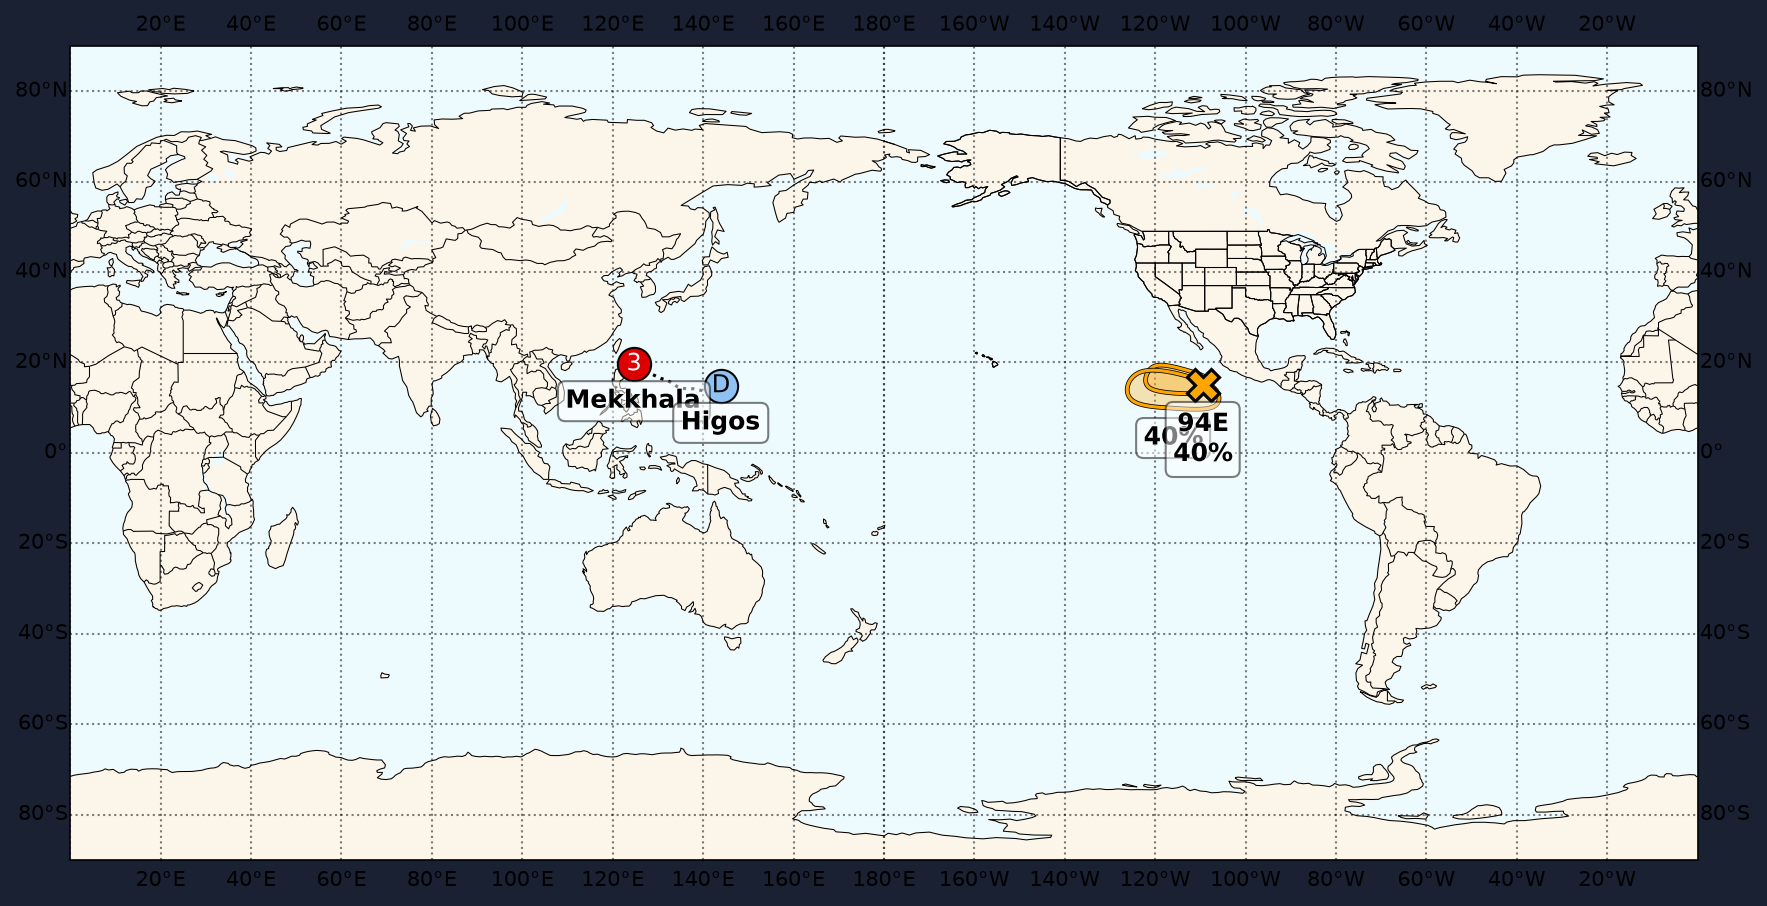
A whole-basin summary of all active tropical cyclones and the NHC
Tropical Weather Outlook, generated with the
tropycal
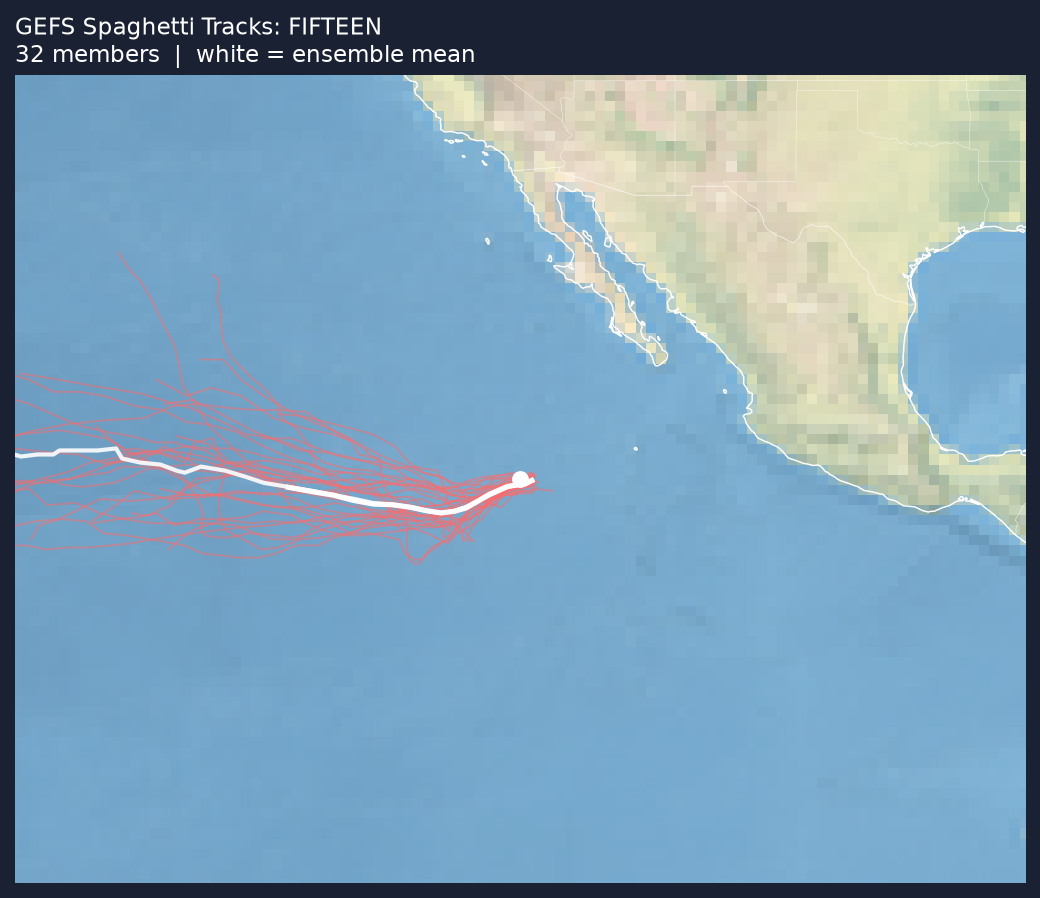
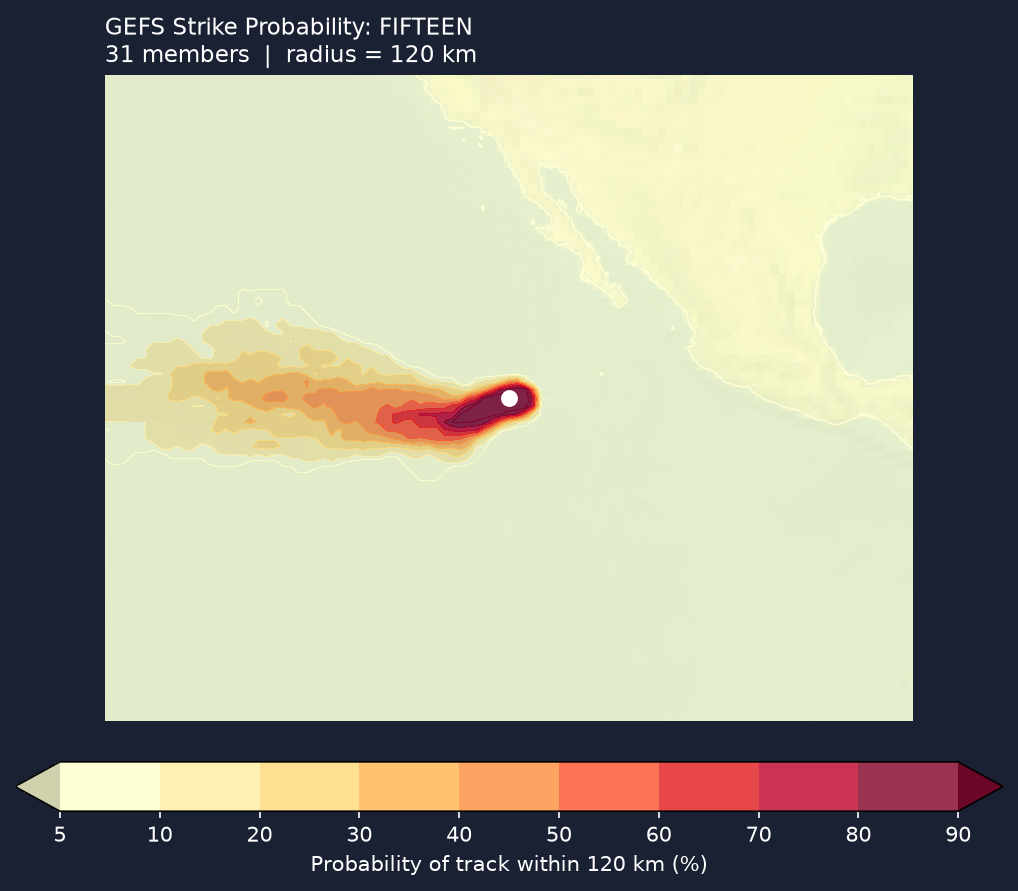
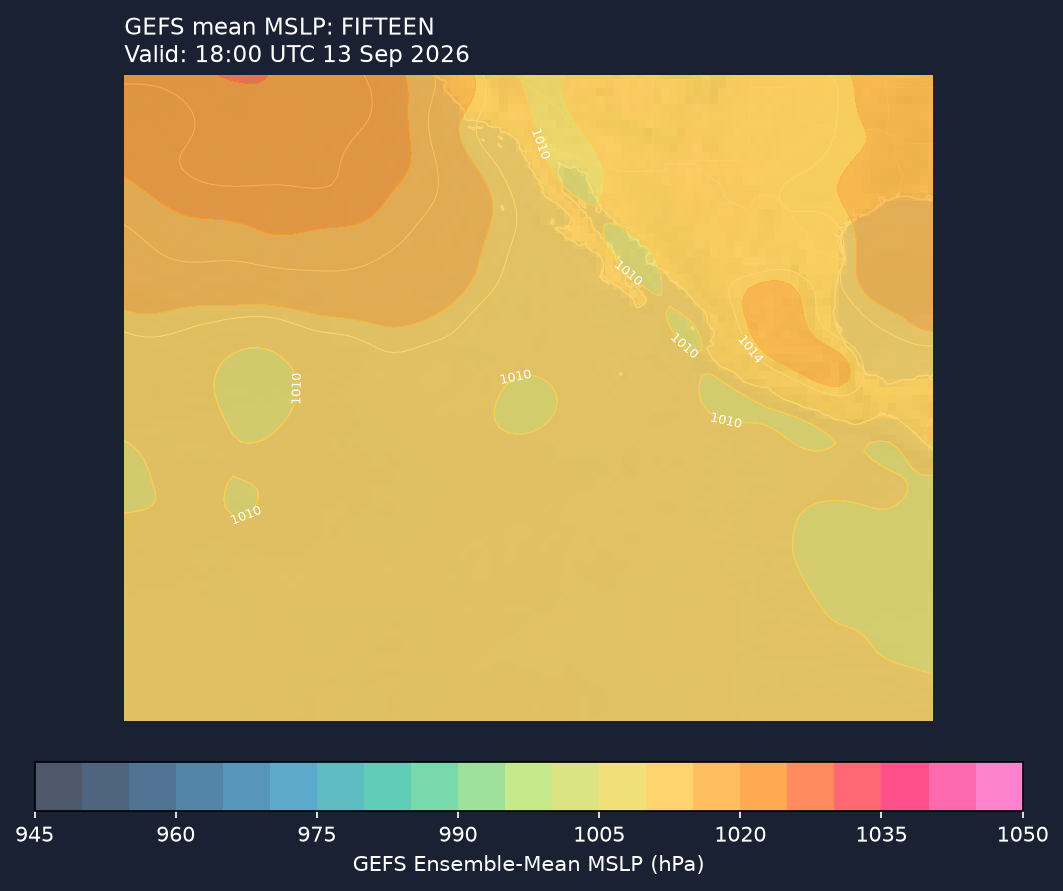
package. Select a storm below for its official forecast and model guidance.
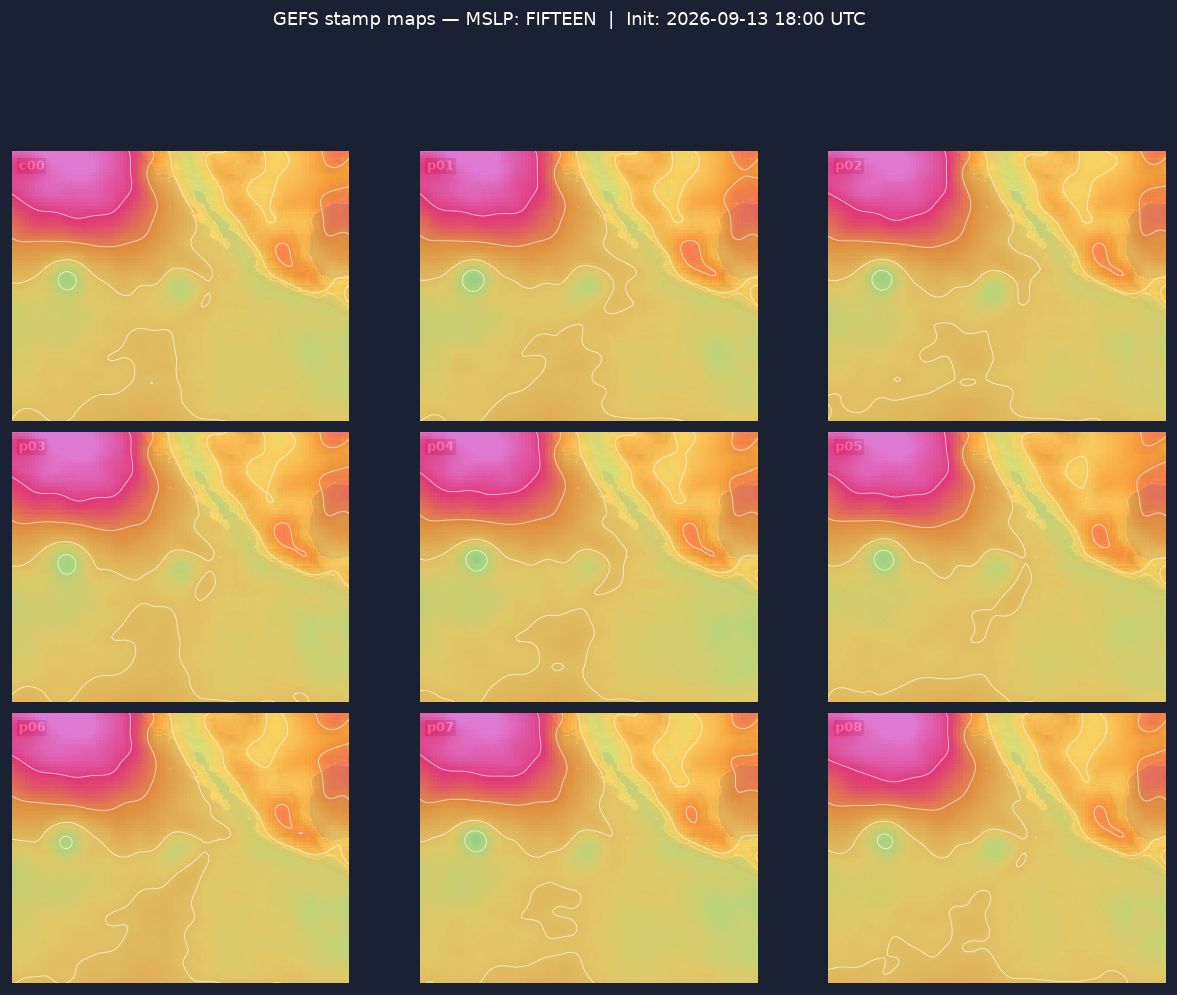
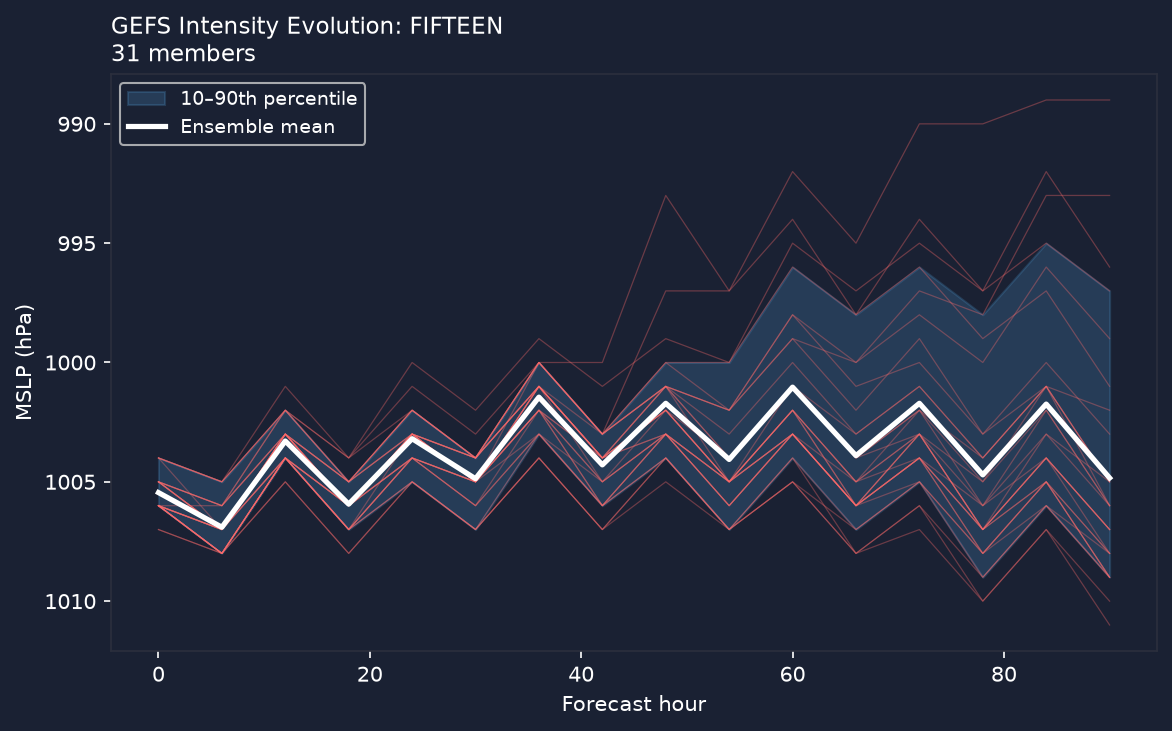
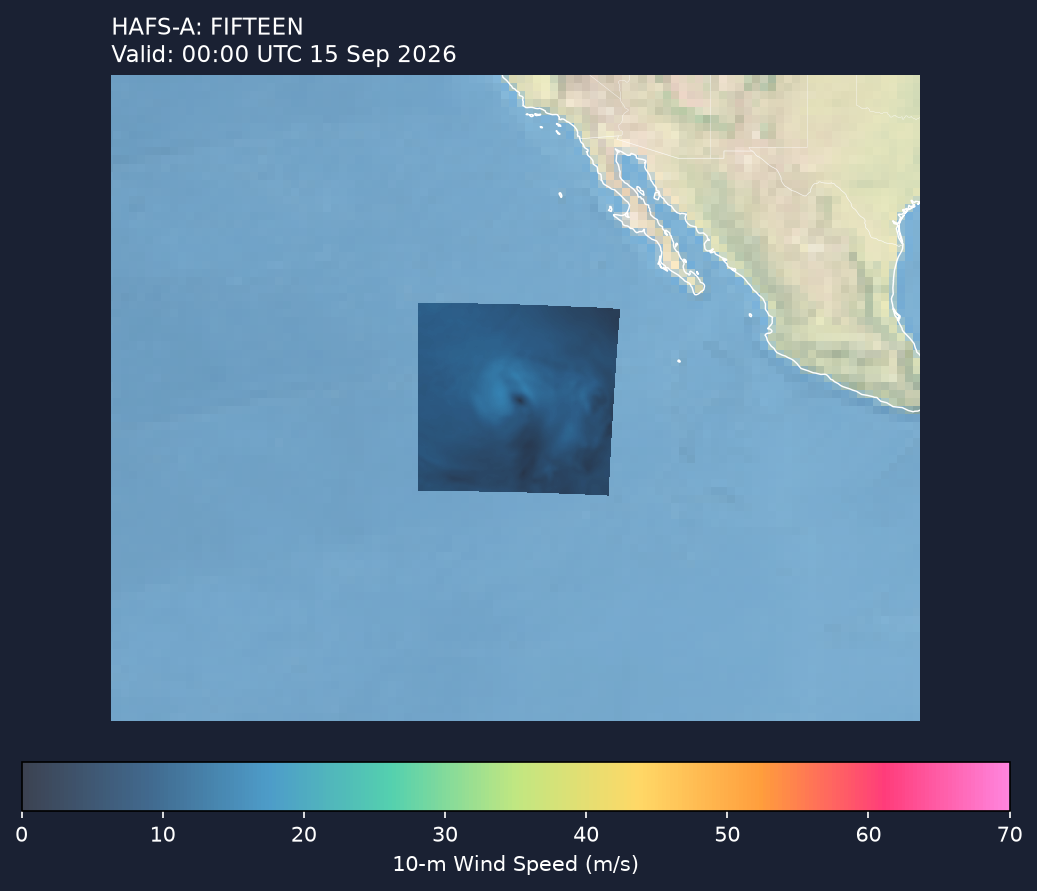
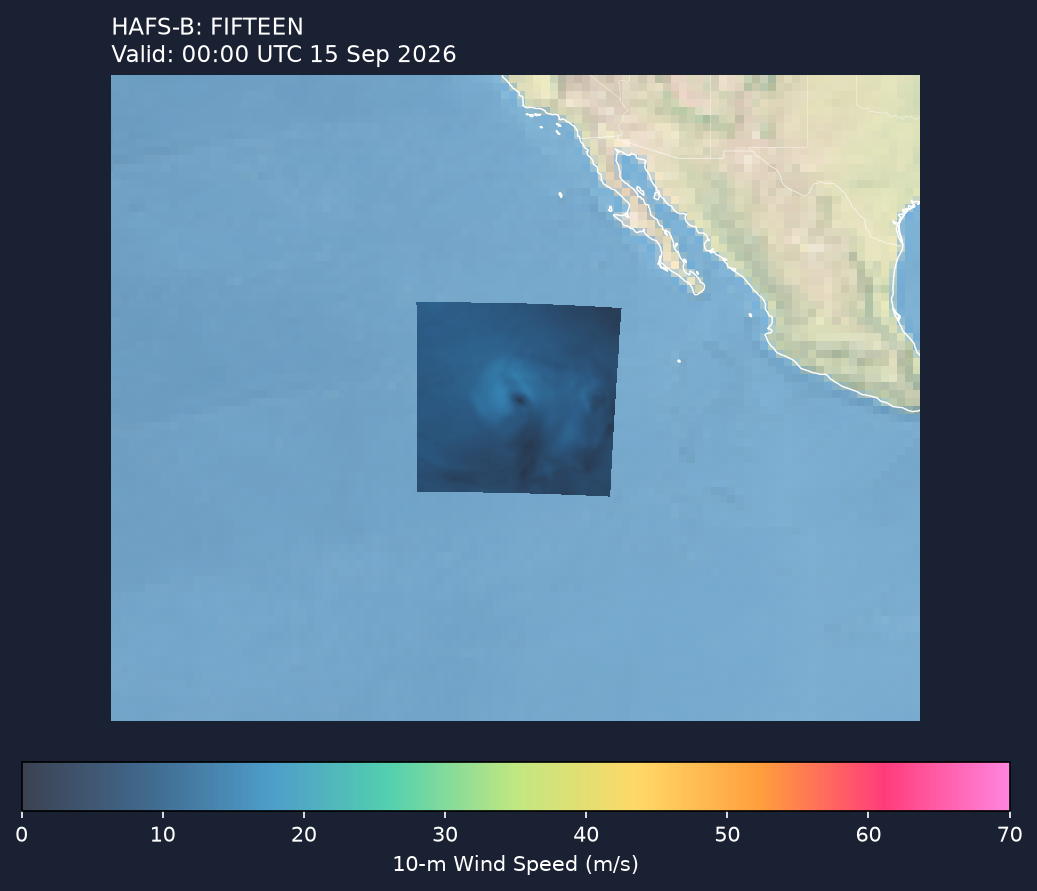
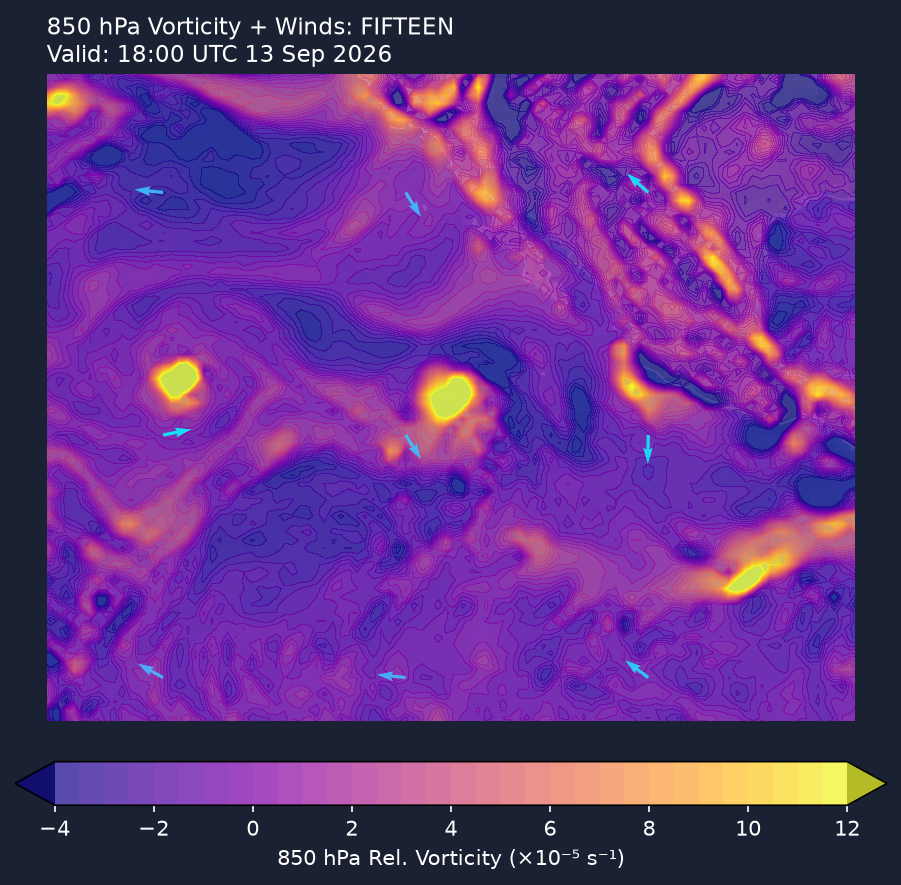
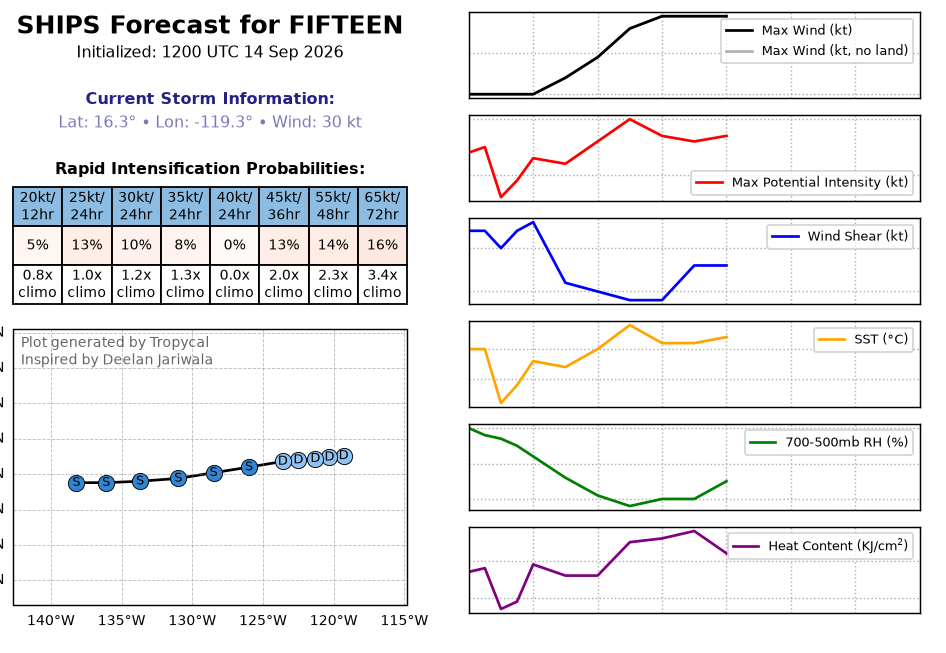
HAFS and GEFS guidance is only available for storms in the US/NHC domain (Atlantic & East/Central Pacific). For this system, the basin summary and best-track position are shown.
WDPN31 PGTW 160300
MSGID/GENADMIN/JOINT TYPHOON WRNCEN PEARL HARBOR HI//
SUBJ/PROGNOSTIC REASONING FOR TROPICAL DEPRESSION 24W (TWENTYFOUR)
WARNING NR 003//
RMKS/
1. FOR METEOROLOGISTS.
2. 6 HOUR SUMMARY AND ANALYSIS.
SUMMARY:
INITIAL POSITION: 15.0N 148.7E
INITIAL INTENSITY: 30 KTS
GEOGRAPHIC REFERENCE: 168 NM EAST OF SAIPAN
MOVEMENT PAST 6 HOURS: NORTH-NORTHWESTWARD AT 02 KTS
SIGNIFICANT WAVE HEIGHT: 14 FEET
SATELLITE ANALYSIS, INITIAL POSITION AND INTENSITY DISCUSSION:
ANIMATED MULTISPECTRAL SATELLITE IMAGERY (MSI) DEPICTS TROPICAL
DEPRESSION 24W WITH A MUCH MORE DEFINED AND SYMMETRIC LOW-LEVEL
CIRCULATION CENTER (LLCC) THAT IS NOW PARTIALLY EXPOSED. CONVECTIVE
ACTIVITY REMAINS MOSTLY CONFINED TO THE SOUTHWESTERN PERIPHERY. A
TIMELY 152319Z METOP-C ASCAT BULLSEYE PASS REVEALED A DEFINED
CENTER WITH WINDS OF 25-30 KTS PRIMARILY LOCATED WITHIN THE
SOUTHEASTERN QUADRANT OF THE SYSTEM. THE INITIAL POSITION AND
INTENSITY ARE BOTH PLACED WITH HIGH CONFIDENCE BASED ON THE ASCAT
DATA. ENVIRONMENTAL ANALYSIS INDICATES THAT 24W REMAINS PLACED
WITHIN A MARGINALLY FAVORABLE ENVIRONMENT CHARACTERIZED BY MODERATE
OUTFLOW ALOFT, LOW (5-10 KTS) NORTHERLY VERTICAL WIND SHEAR, DRY
AIR ENTRAINMENT FROM THE NORTH, AND WARM (29-30 C) SEA SURFACE
TEMPERATURES.
INITIAL WIND RADII BASIS: NOT APPLICABLE (THERE ARE NO INITIAL WIND
RADII).
CURRENT STEERING MECHANISM: THE NORTHWARD EXTENSION OF AN ELONGATED
NEAR EQUATORIAL RIDGE (NER) POSITIONED TO THE SOUTHEAST
AGENCY DVORAK AND AUTOMATED FIXES:
PGTW: T1.5 - 25 KTS
RJTD: T2.0 - 30 KTS
CIMSS SATCON: 33 KTS AT 152027Z
CIMSS ADT: 34 KTS AT 160000Z
CIMSS AIDT: 32 KTS AT 160000Z
CIMSS D-MINT: 28 KTS AT 152026Z
CIMSS D-PRINT: 38 KTS AT 160000Z
FORECASTER ASSESSMENT OF CURRENT ENVIRONMENT: MARGINALLY FAVORABLE
VWS: 5-10 KTS
SST: 29-30 CELSIUS
OUTFLOW: MODERATE POLEWARD AND EQUATORWARD
OTHER FACTORS: DRY AIR ENTRAINMENT FROM THE NORTH
ANALYSIS CONFIDENCE:
INITIAL POSITION: HIGH
INITIAL INTENSITY: HIGH
INITIAL WIND RADII: NOT APPLICABLE
3. FORECAST REASONING.
SIGNIFICANT FORECAST CHANGES: THERE ARE NO SIGNIFICANT CHANGES TO
THE FORECAST FROM THE PREVIOUS WARNING.
FORECAST DISCUSSION: 24W HAS NOW STARTED ON ITS NORTHWARD TRACK,
PRIMARILY DRIVEN BY THE ELONGATED NER POSITIONED TO THE SOUTHEAST.
THE SUBTROPICAL RIDGE (STR) THAT IS CURRENTLY TO THE NORTHEAST OF THE
SYSTEM IS EXPECTED TO REORIENT EASTWARD AND WEAKEN AS AN UPPER-LEVEL
TROUGH MOVES IN FROM THE WEST. AS A RESULT, A GENERALLY NORTHWARD
TRACK IS EXPECTED TO PERSIST THROUGH TAU 24. THE SYSTEM WILL THEN
BEGIN TO INTERACT WITH THE SOUTHWESTERN PERIPHERY OF THE STR NEAR TAU
24, WHICH WILL DIRECT THE VORTEX NORTHWESTWARD THROUGH TAU 72. AFTER
TAU 72, 24W IS FORECAST TO ROUND THE WESTERN EXTENT OF THE RIDGE WITH
A NORTHWARD TURN THROUGH TAU 96. FOLLOWING TAU 96, THE SYSTEM WILL
BEGIN TO ACCELERATE NORTHEASTWARD AS IT CONTINUES TO ROUND THE RIDGE
AXIS, TRACKING CLOSE TO THE EASTERN COAST OF HONSHU. 24W IS CURRENTLY
FORECAST TO STAY EAST OF HONSHU, HOWEVER, THERE IS STILL SOME
UNCERTAINTY IN THE TIMING AND TRAJECTORY OF THE NORTHEASTWARD TURN
AFTER TAU 96. IF 24W STAYS ON A NORTHWESTWARD TRACK FOR LONGER THAN
ANTICIPATED, IT COULD GET CLOSER TO THE COAST AND IMPACT AREAS NEAR
THE KANTO PLAIN REGION. IN TERMS OF INTENSITY, 24W IS FORECAST TO
STEADILY INTENSIFY THROUGH TAU 60 AS THE VORTEX CONSOLIDATES AND
POLEWARD OUTFLOW GREATLY IMPROVES. AFTER TAU 60, THE SYSTEM WILL
BATTLE WITH DRY AIR ENTRAINMENT FROM THE WEST, CAUSING THE SYSTEM TO
HALT THE INTENSIFICATION TREND. IF 24W IS ABLE TO CONSOLIDATE AND FORM
A MORE COMPACT CORE, THEN FURTHER INTENSIFICATION COULD BE POSSIBLE.
AFTER TAU 96, SOUTHERLY SHEAR IS EXPECTED TO INCREASE WHILE THE SYSTEM
SIMULTANEOUSLY TAPS INTO A ROBUST POLEWARD OUTFLOW CHANNEL PROVIDED BY
A STRONG JET STREAK OVER NORTHERN JAPAN. NOTABLY, THE HAFS-A MODEL
SHOWS…
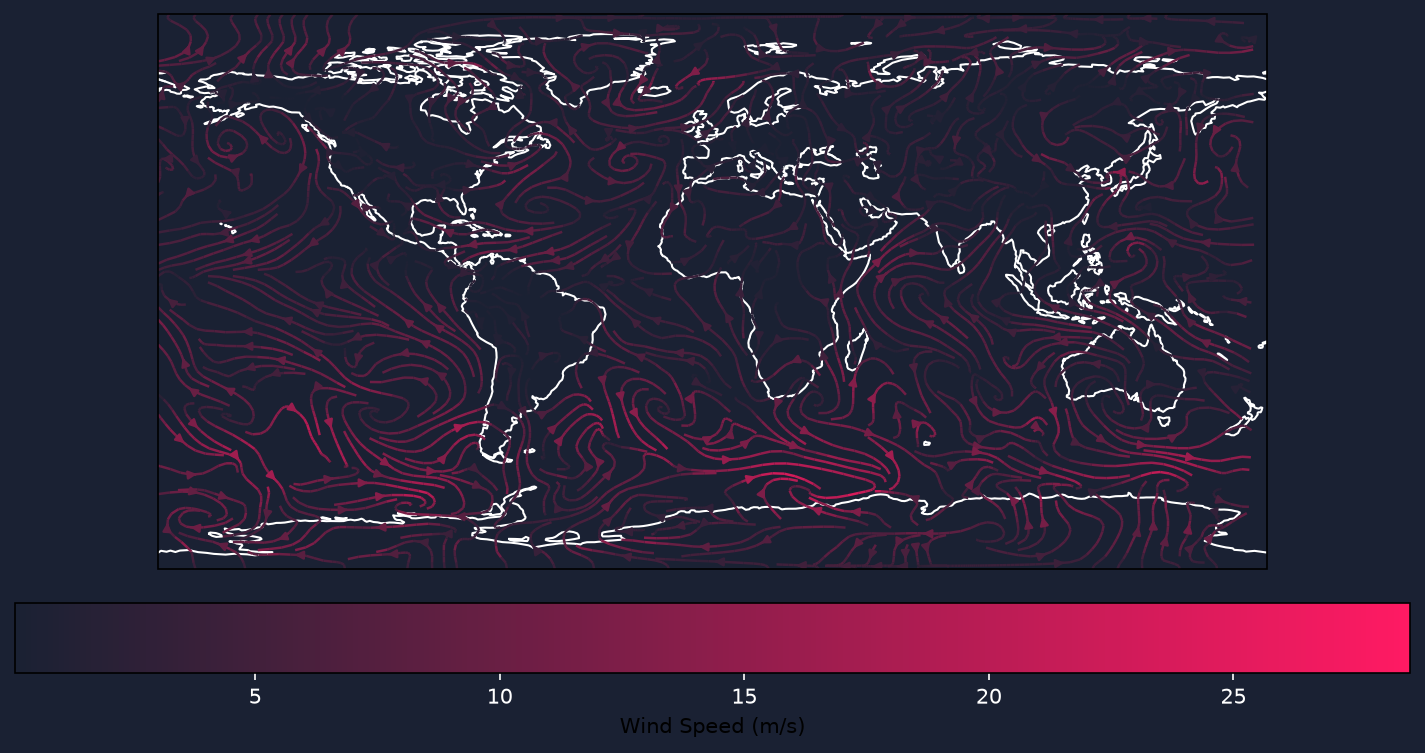
ECMWF 10-m Streamlines
This map visualizes near-surface winds from the ECMWF operational model using streamlines — continuous curves that show the direction of the wind at every point. Streamlines help us visually detect patterns of atmospheric flow, such as jets, troughs, and areas of rotation.
Forecasters at the NHC monitor 10-meter wind fields for signs of a closed low-level circulation — a common feature of early tropical cyclone formation. When streamlines wrap into a tight, circular pattern and form a closed loop, it may signal that a system is transitioning from a disorganized disturbance into a structured cyclone.
This early organization of wind flow is a key threshold in classifying an area as a potential tropical cyclone. While other ingredients like convection and mid-level humidity are also necessary, closed low-level circulation is often the first structural milestone forecasters look for.
Look for small, circular loops in the streamlines over oceanic regions — especially where other environmental factors also align for storm formation.
ECMWF Predictions
No active storm found in ECMWF data at this time.
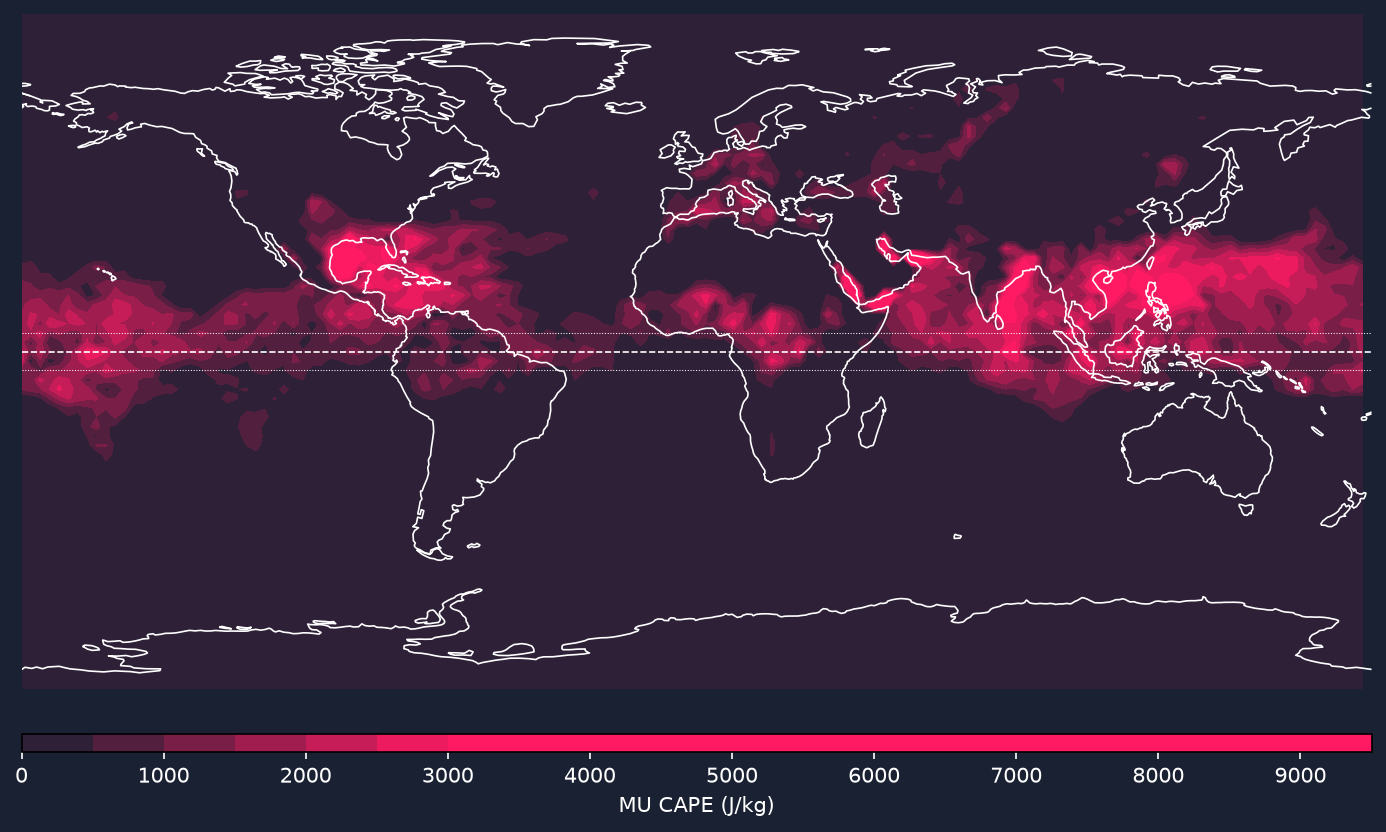
Environmental Indicators
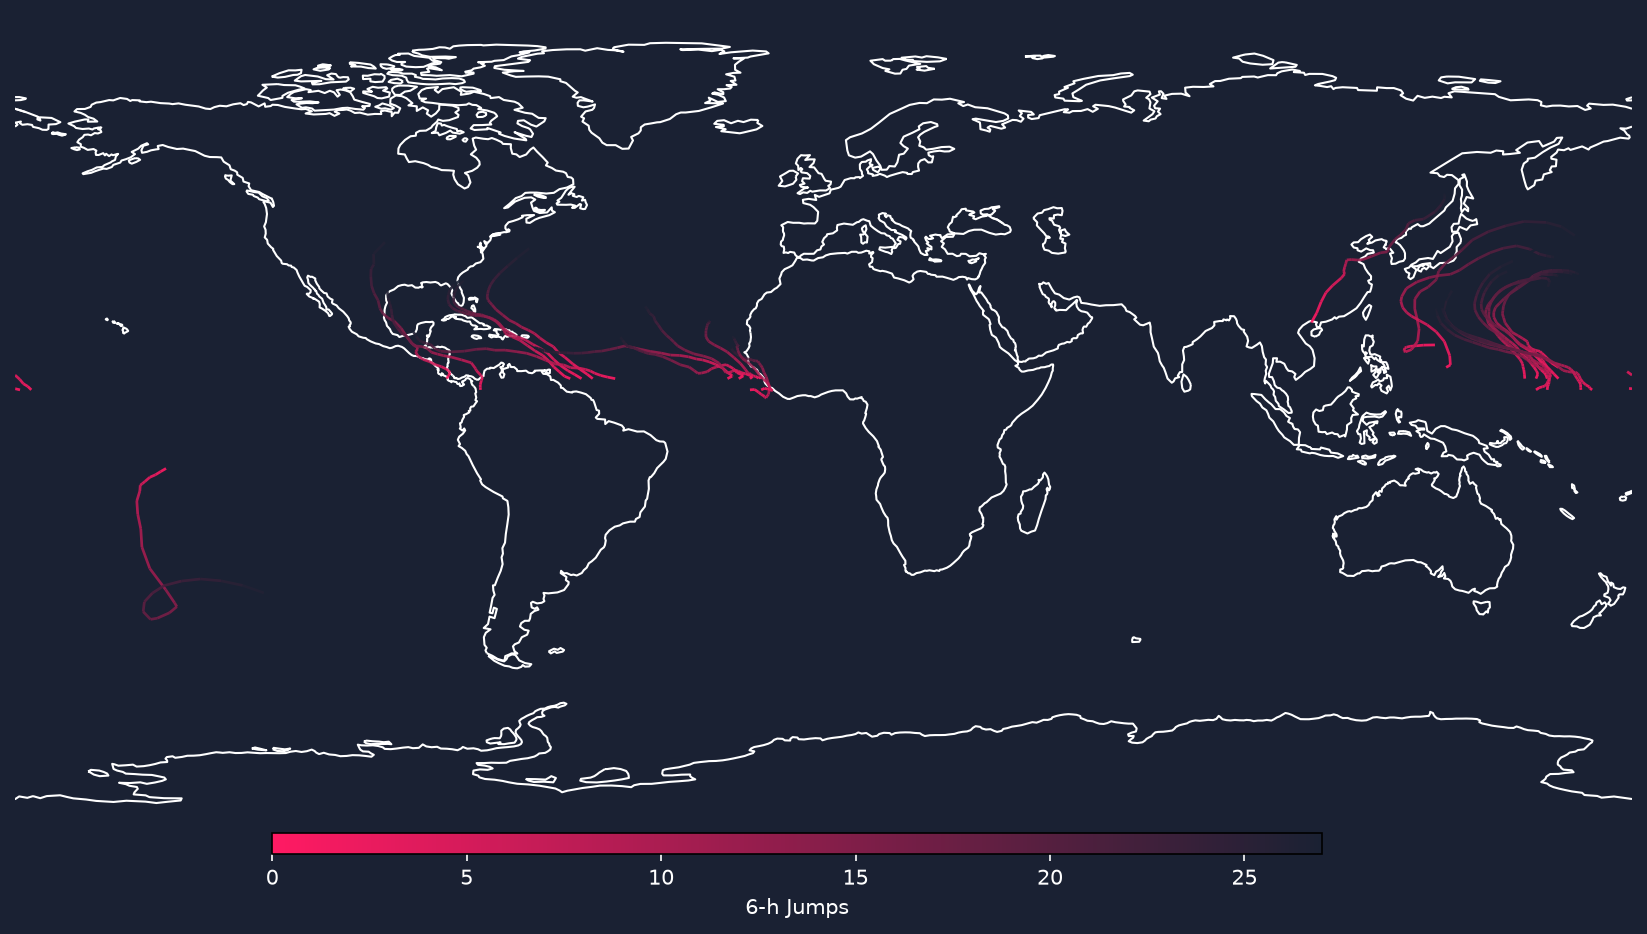
Hypothetical TC Drift Paths
This map displays hypothetical tropical cyclone (TC) paths projected from genesis-favorable zones identified by an environmental mask. These paths are computed using the Emanuel Beta and Advection Model, a physically based framework that estimates the motion of nascent cyclones by combining steering-level winds and planetary rotation effects.
The model blends winds from two critical pressure levels — 850 hPa (lower troposphere) and 250 hPa (upper troposphere) — weighted toward the lower level where most of a tropical cyclone's mass resides. It also incorporates a background component associated with beta drift, which arises from the variation of the Coriolis force with latitude.
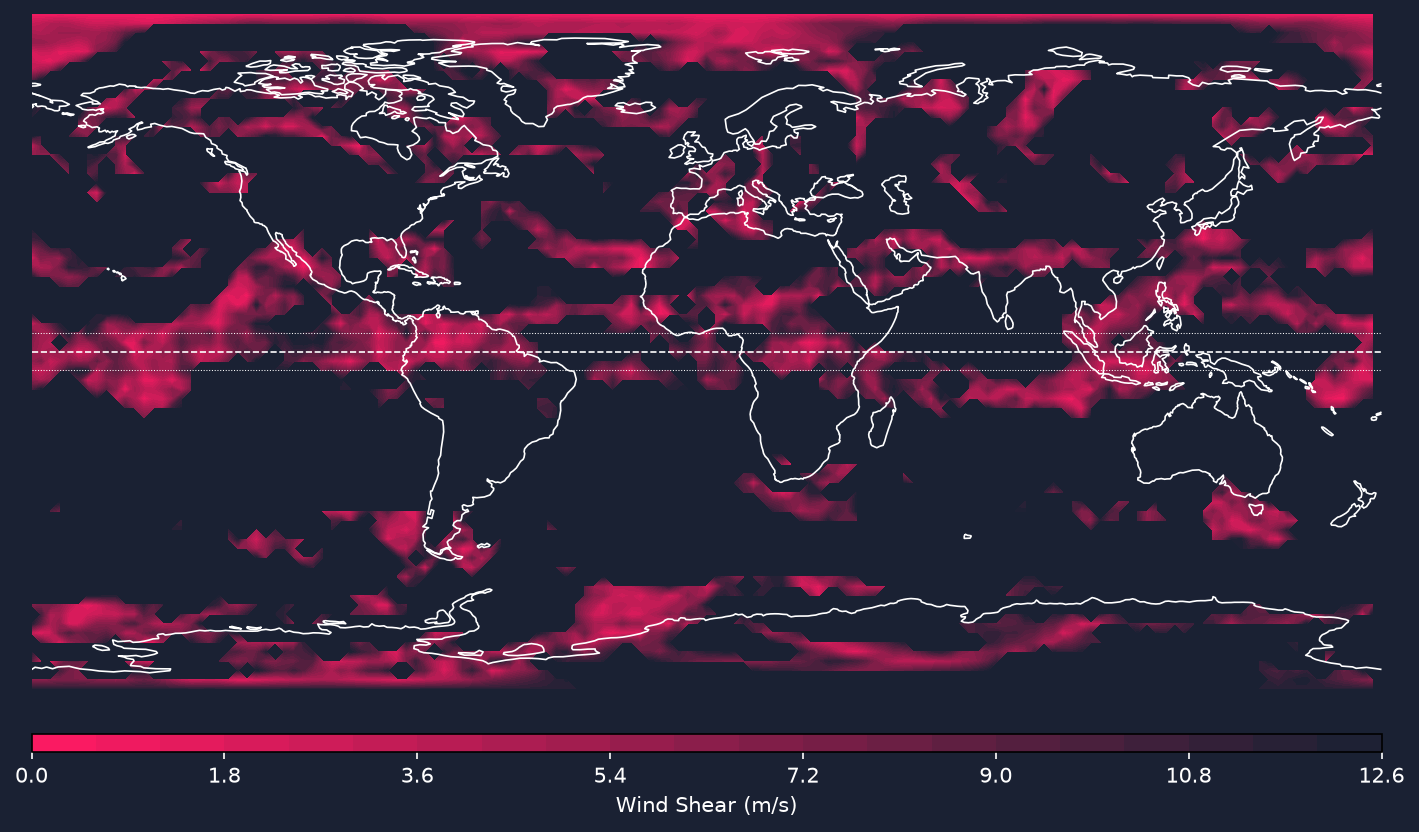
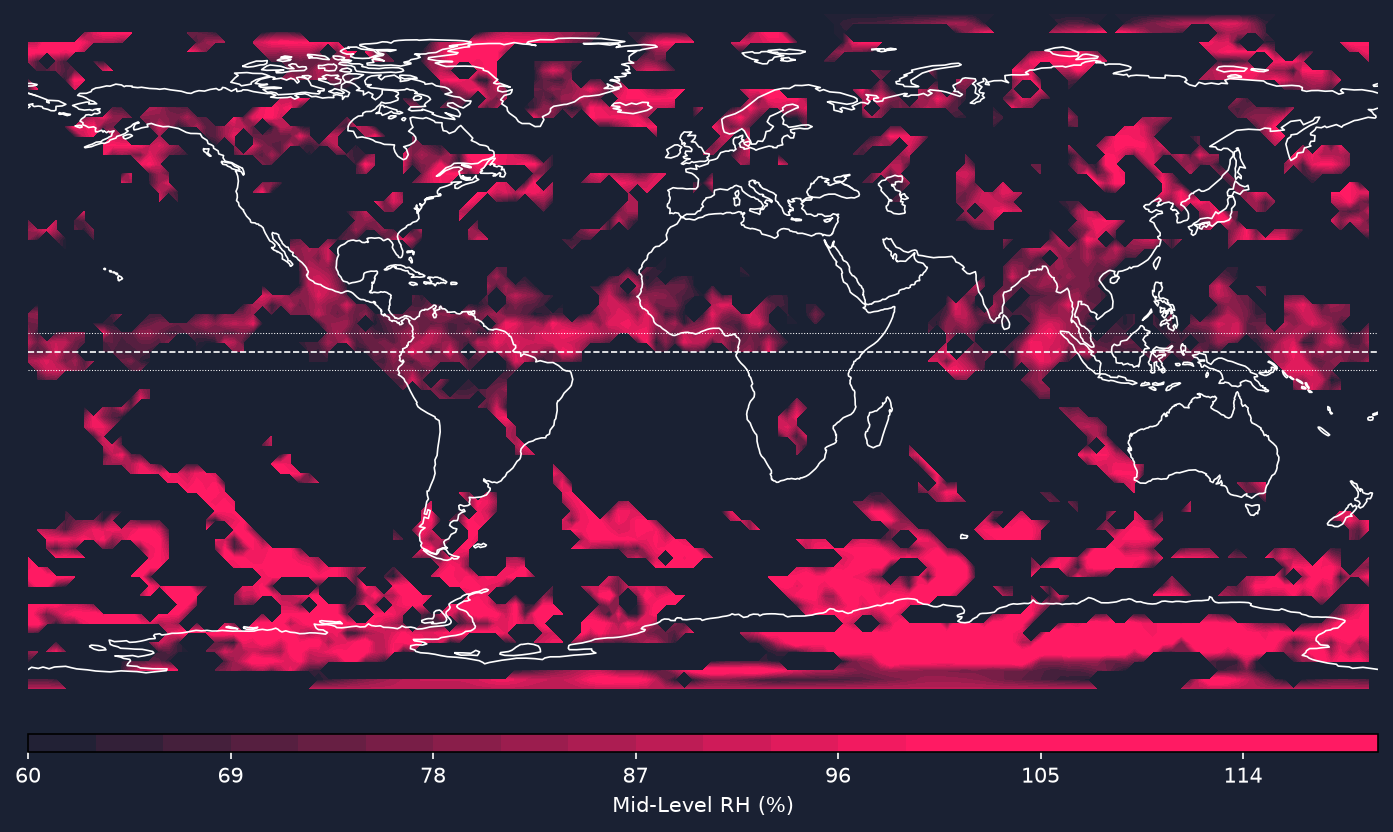
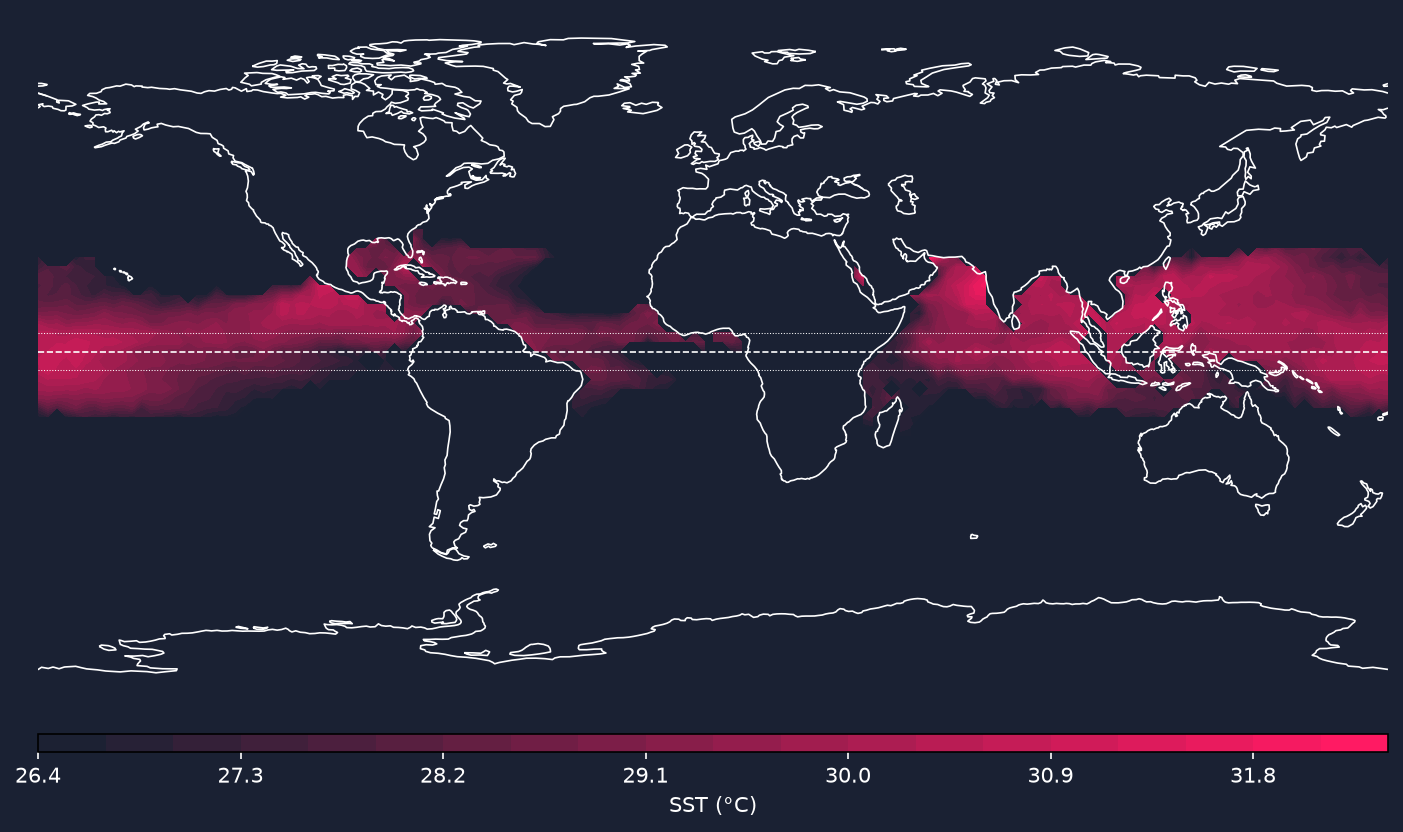
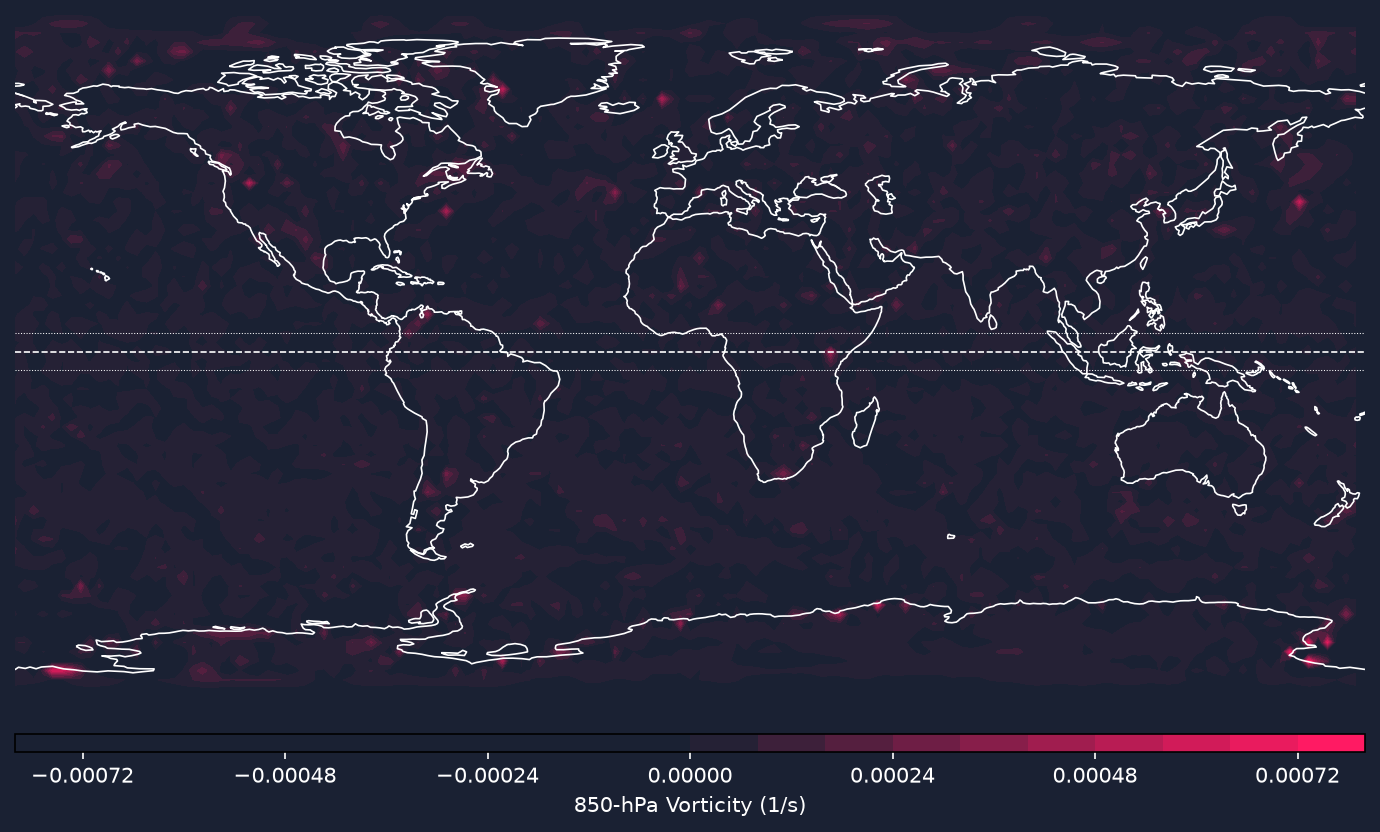
Each pink trajectory represents a storm initialized from a grid cell where all five environmental thresholds were favorable: high CAPE, low vertical wind shear, high mid-level humidity, warm SSTs, and positive low-level vorticity. Arrows darken with time, tracing the cyclone’s evolution in 6-hour steps. These tracks can move over land given the steering winds, but in reality these storms weaken quickly when no longer over warm water. This means the tracks that move over significant would likely die out quickly and are not well represented in this model.
Hypothetical storms often drift westward and poleward, steered by large-scale tropical flow and Earth's rotation — this helps forecasters anticipate where early-stage disturbances might evolve into organized storms.
Pressure & Rainfall (hPa)
This chart shows 24-hour forecasts of surface pressure (in hPa) and precipitation (in mm) for select U.S. cities.
The data comes from the Open-Meteo API,
which sources its predictions from high-resolution numerical weather models like ICON (from the German Weather Service)
and ECMWF's IFS. These are advanced general circulation models (GCMs) that solve physical equations governing the
atmosphere — including thermodynamics, fluid motion, and radiation — to simulate and forecast future states of weather.
A sudden drop in pressure may signal the approach of a developing storm system. Increasing rainfall intensity often
tracks with tropical activity or frontal systems. These paired indicators help visualize evolving atmospheric instability and potential hazards.
NBDC Gulf Buoy Data
This data comes from the National Data Buoy Center (NDBC), a division of NOAA responsible for monitoring ocean
and atmospheric conditions using moored buoys, coastal stations, and drifting floats. These sensors play a vital role in
tracking tropical cyclone development by recording variables like wind speed,
barometric pressure, air & sea surface temperatures, and wave height — all of which
help determine storm structure and intensification.
A sudden drop in sea-level pressure or a spike in wind gusts can signal rapid cyclone strengthening.
Water temperature above ~26°C is a key fuel source for tropical cyclones. Wave and swell height give insight
into the storm’s reach and energy transfer across the ocean. Monitoring these in real time helps improve forecasts and early warnings.
Wind: E (90°), 9.7 kt | Gust: 11.7 kt
Pressure: 30.05 steady | Air Temp: 85.6 °F
Water Temp: 87.6 °F | Dew Point: 80.6 °F
Swell: 1.6 ft | Wind Wave: 2.0 ft
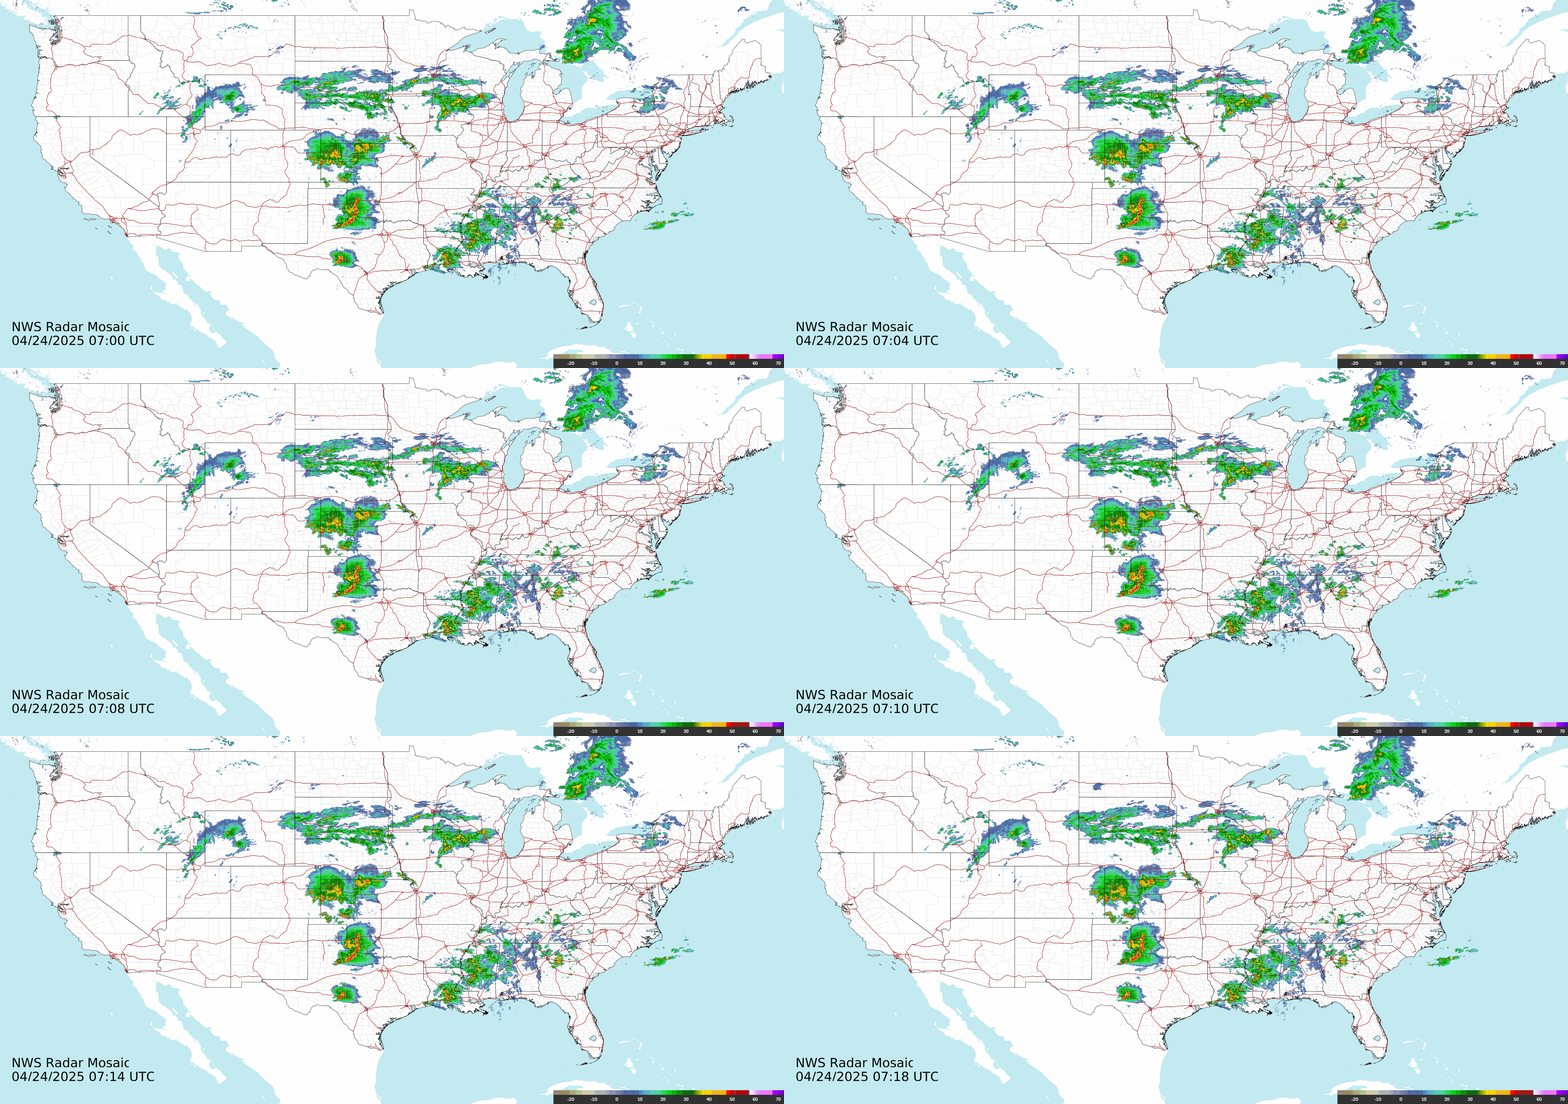
NWS U.S. Radar
The National Weather Service (NWS) collects radar data using the NEXRAD (Next Generation Radar) network —
a nationwide system of over 150 high-resolution Doppler radar stations. Radar works by emitting pulses of energy
that bounce off precipitation (like raindrops, hail, or snow) and return to the radar dish. Doppler radar not only detects the
location and intensity of storms, but also their motion — by measuring shifts in frequency caused by movement of particles toward
or away from the radar site. This allows meteorologists to spot rotating storms and potential tornadoes in real time.
GOES 15-min Satellite
The GOES (Geostationary Operational Environmental Satellite) system is operated by NOAA
and provides continuous weather observation over the Americas. Orbiting 22,300 miles above Earth,
GOES satellites deliver high-resolution imagery every 15 minutes, helping track tropical systems, cloud formation,
and atmospheric motion in real time. The Geocolor imagery shown here combines visible and infrared data
to highlight clouds, land, and sea in a natural-looking format.
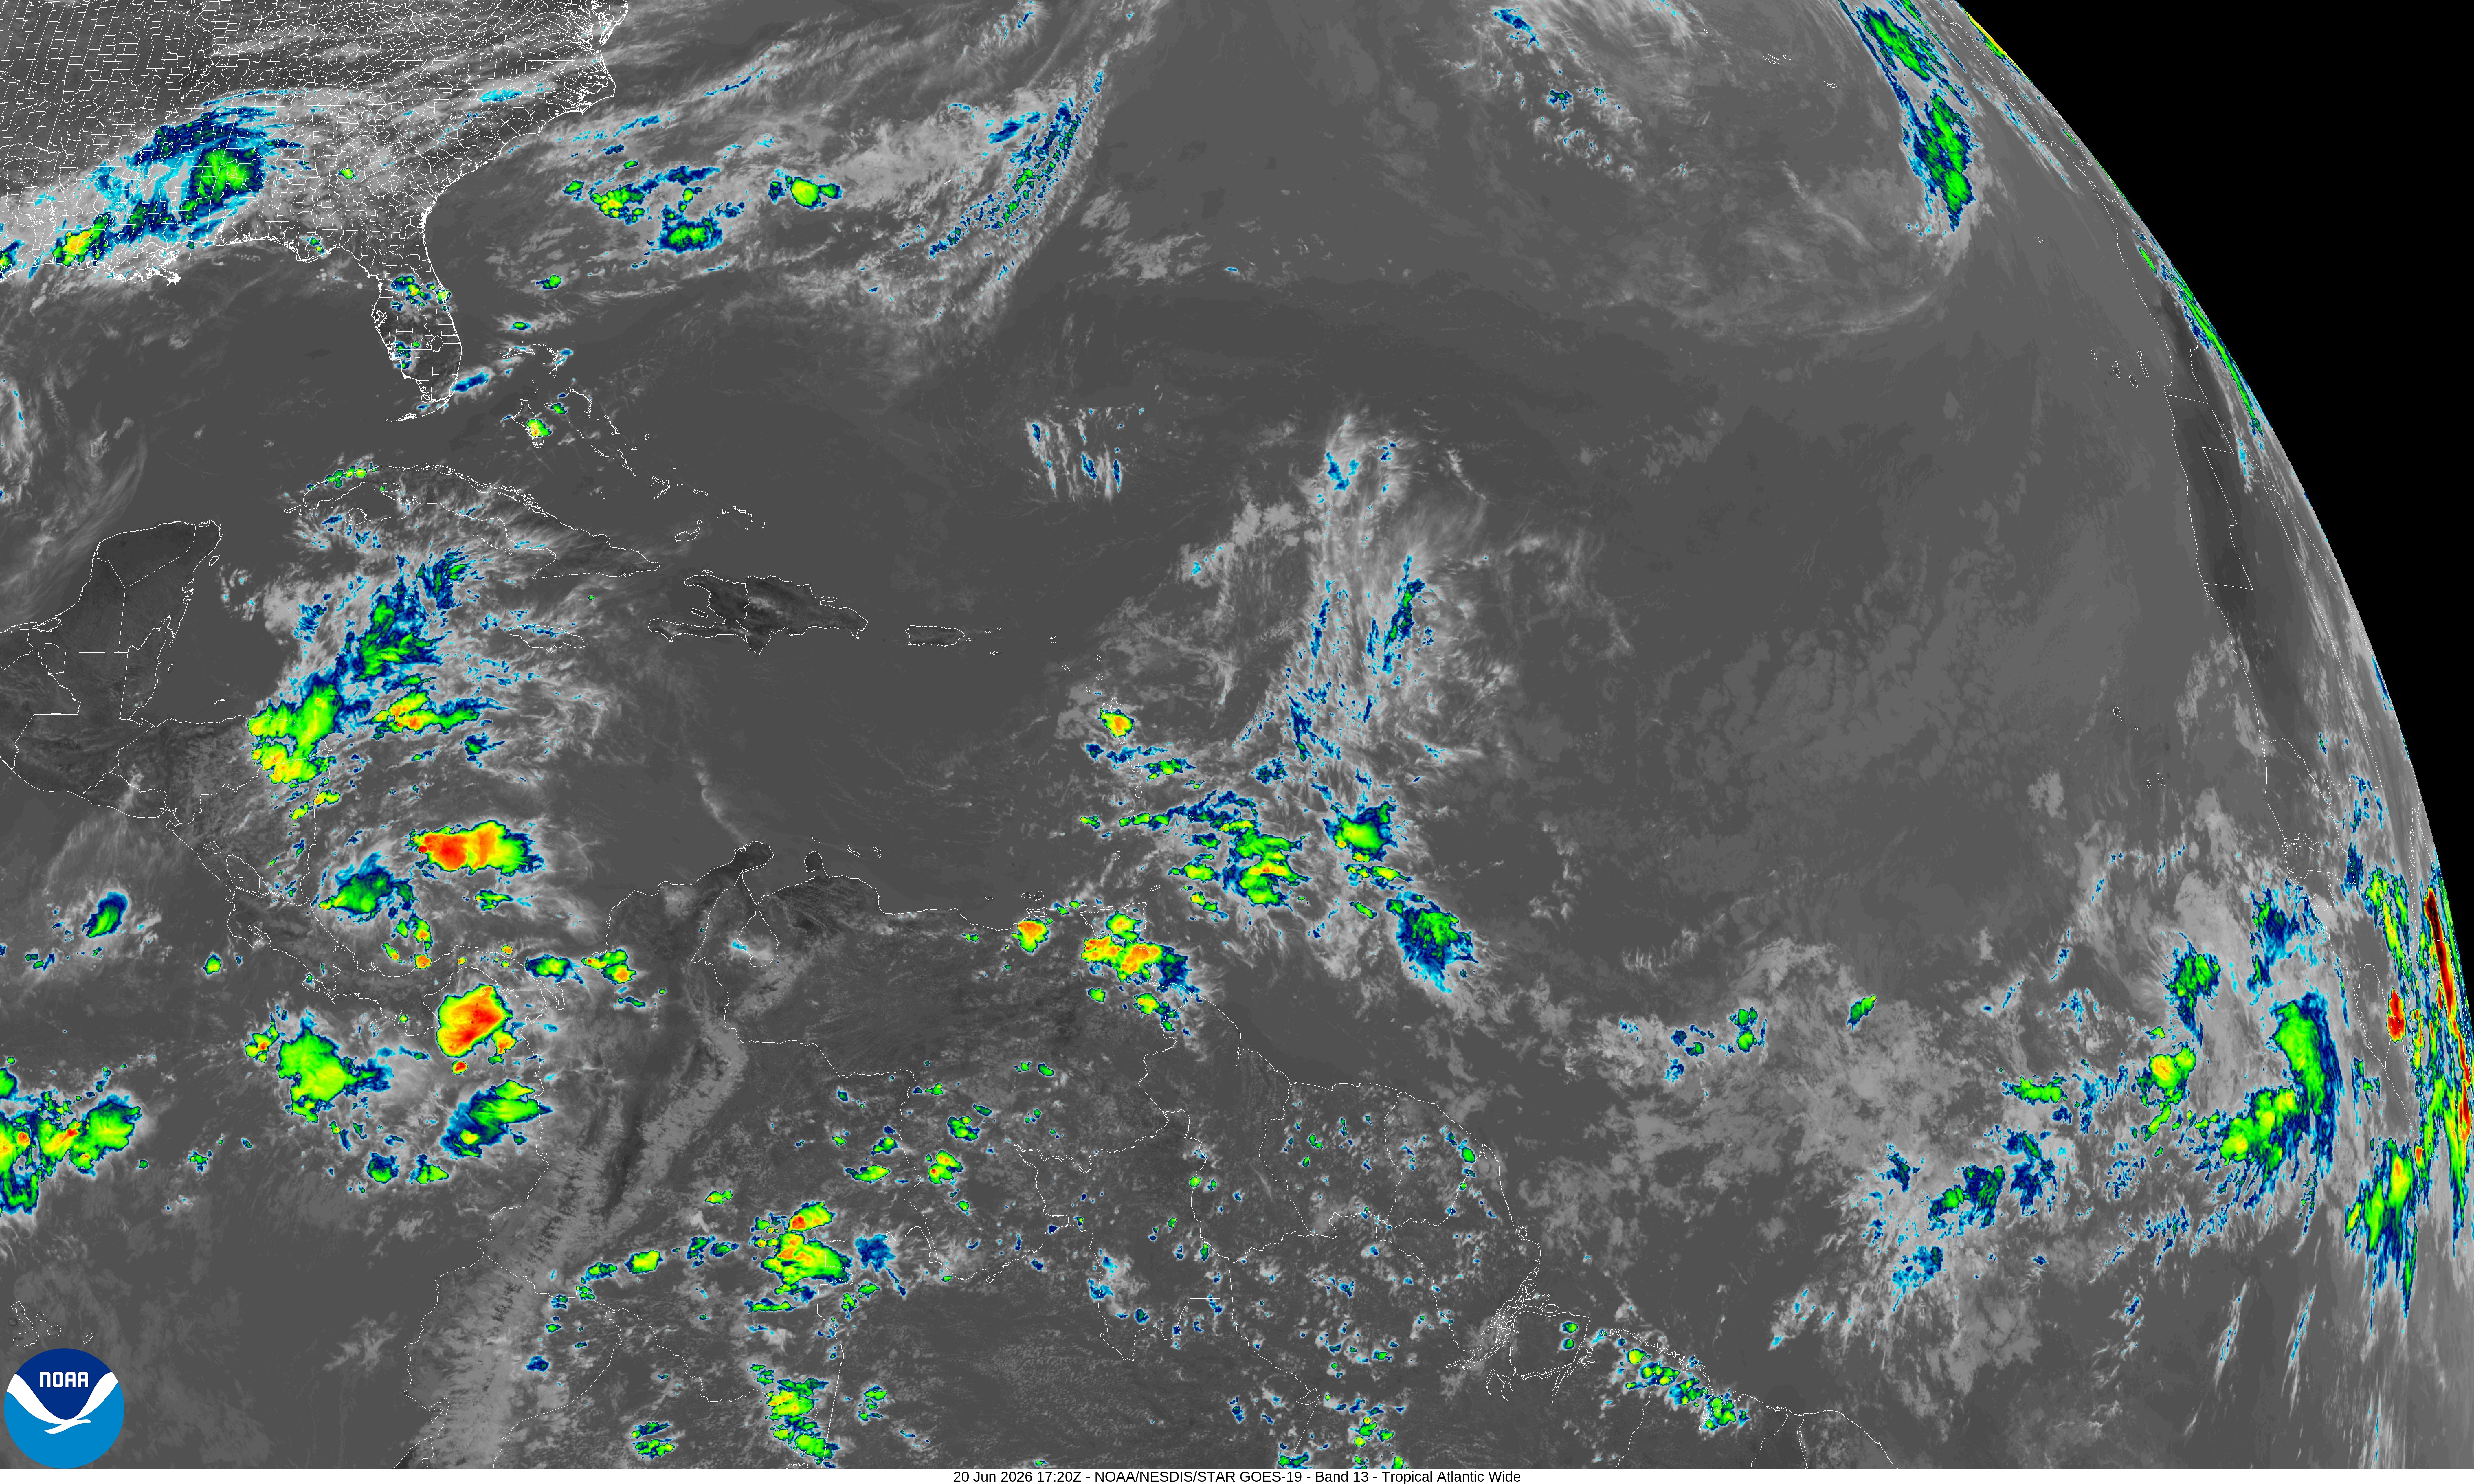
GOES Band 13 – Infrared (IR) Imagery
Band 13 (10.3 µm) is one of the most important infrared channels for tropical meteorology, measuring emitted radiation from cloud tops.
Colder colors (red, yellow) signal deep convection, where strong thunderstorms punch through the upper atmosphere.
These features often indicate the early stages of tropical cyclone formation.
Most recent GOES Band 13 image. Provided by NOAA/NESDIS/STAR.